Abstract
Background: Comparison of parameters between two or more groups forms the basis of hypothesis testing. Statistical tests (and statistical significance) are designed to report the likelihood the observed results are caused by chance alone, given that the null hypothesis is true.
Methods: To demonstrate the concepts described, we utilized the Nationwide Inpatient Sample for patients admitted for emergency general surgery (EGS) and those admitted with non-EGS diagnoses. Depending on the type and distribution of individual variables, appropriate statistical tests were applied.
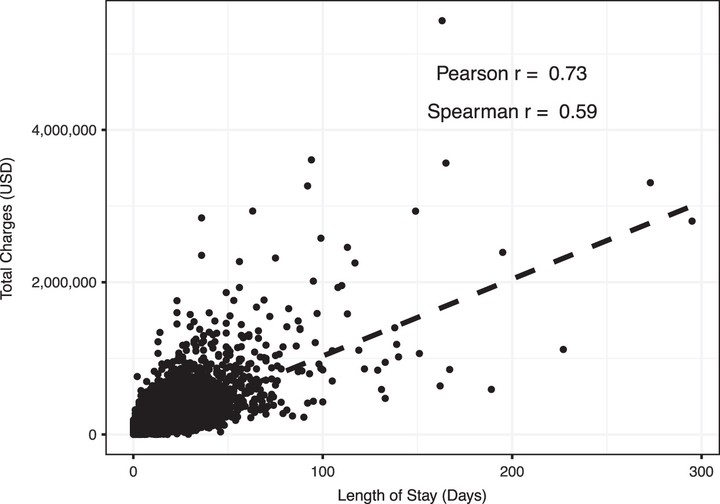
Results:* Comparison of numerical variables between two groups is begun with a simple correlation, depicted graphically in a scatterplot, and assessed statistically with either a Pearson or Spearman correlation coefficient. Normality of numerical variables is then assessed and in the case of normality, a t-test is applied when comparing two groups, and an analysis of variance (ANOVA) when comparing three or more groups. For data that are not distributed normally, a Wilcoxon rank sum (Mann-Whitney U) test may be used. For categorical variables, the χ2 test is used, unless cell counts are less than five, in which case the Fisher exact test is used. Importantly, both the ANOVA and χ2 test are used to assess for overall differences between two or more groups. Individual pair comparison tests, as well as adjusting for multiple comparisons must be used to identify differences between two specific groups when there are more than two groups.
Conclusion: A basic understanding of statistical significance, and the type and distribution of variables is necessary to select the app