Abstract
Background: Standardized and concise data presentation forms the base for subsequent analysis and interpretation. This article reviews types of data, data properties and distributions, and both numerical and graphical methods of data presentation.
Methods: For the purposes of illustration, the National Inpatient Sample was queried to categorize patients as having either emergency general surgery or non-emergency general surgery admissions.
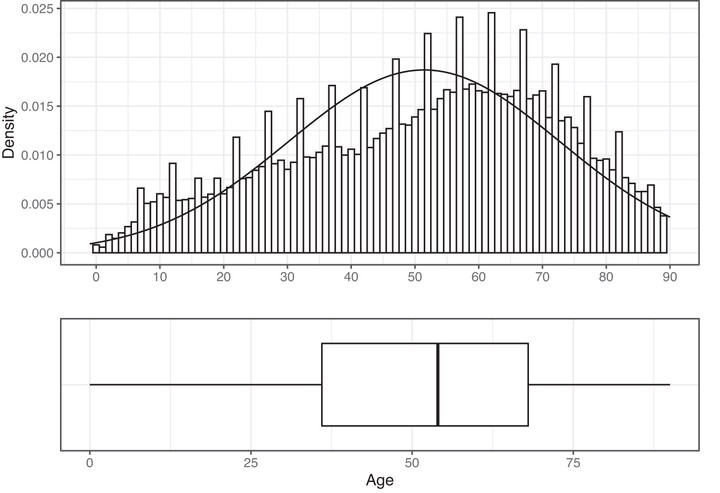
Results: Variables are categorized as either categorical or numerical. Within the former, there are ordinal and or nominal subtypes; within the latter, there are ratio and interval subtypes. Categorical data are typically displayed as number (%). Numerical data must be assessed for normality as normally distributed data behave in certain patterns that allow for specific statistical tests to be used. Several properties exist for numerical data, including measurements of central tendency (mean, median, and mode), as well as standard deviation, range, and interquartile range. The best initial assessment of the distribution of numerical data is graphical with both histograms and box plots.
Conclusion: Knowledge of the types, distribution, and properties of data is essential to move forward with hypothesis testing.
Wyatt P. Bensken, PhD
Research Investigator & Adjunct Assistant Professor of Population and Quantitative Health Sciences
My expertise is in the use of complex health care data, paired with traditional statistical and novel machine learning approaches, to identify opportunities to improve health, health care, and health outcomes for all.